Highest-Paying Industries by US State — Infographic Map & Dataset
Quick answer: This dataset transcribes a supplied industry-by-state infographic into 50 state polygons and a CSV table. Its visible labels count 30 Information, 11 Mining, four Manufacturing and five Financial Activities states. The image's printed legend totals 51 and disagrees with those labels; neither its rankings nor its BLS attribution have been independently verified.
About this dataset
Explore 50 industry labels from the supplied map, with four categories, a corrected label count and GeoJSON or CSV downloads.
A categorical map transcribed from “Highest-Paying Industry in Each American State”. Its subtitle credits BLS QCEW 2025 annual averages, but the depicted highest-paying-industry claims have not been verified against official records. The visible state labels yield Information in 30 states, Mining in 11, Manufacturing in four and Financial Activities in five. The printed legend instead claims 29, 13, five and four, totaling 51; both the discrepancy and the original legend counts are recorded. All 50 states appear, including Alaska and Hawaii in display insets. No wage amounts are provided in the image or invented in this dataset. Labels are transcribed from a user-supplied infographic and have not been independently verified. The original image's publisher, publication date and content license are unknown. A source attribution or year printed in the image does not verify its selections or methodology.
Data source: User-supplied infographic transcription (unverified)
Attribution: Labels are transcribed from a user-supplied infographic and have not been independently verified. The original image's publisher, publication date and content license are unknown. A source attribution or year printed in the image does not verify its selections or methodology. The image credits U.S. Bureau of Labor Statistics — QCEW, 2025 annual averages. Boundaries: US Census Bureau MAF/TIGER (2018), via geoBoundaries, simplified by GeoDataViewer. Transcribed 2026-10-22; this is not the source publication date.
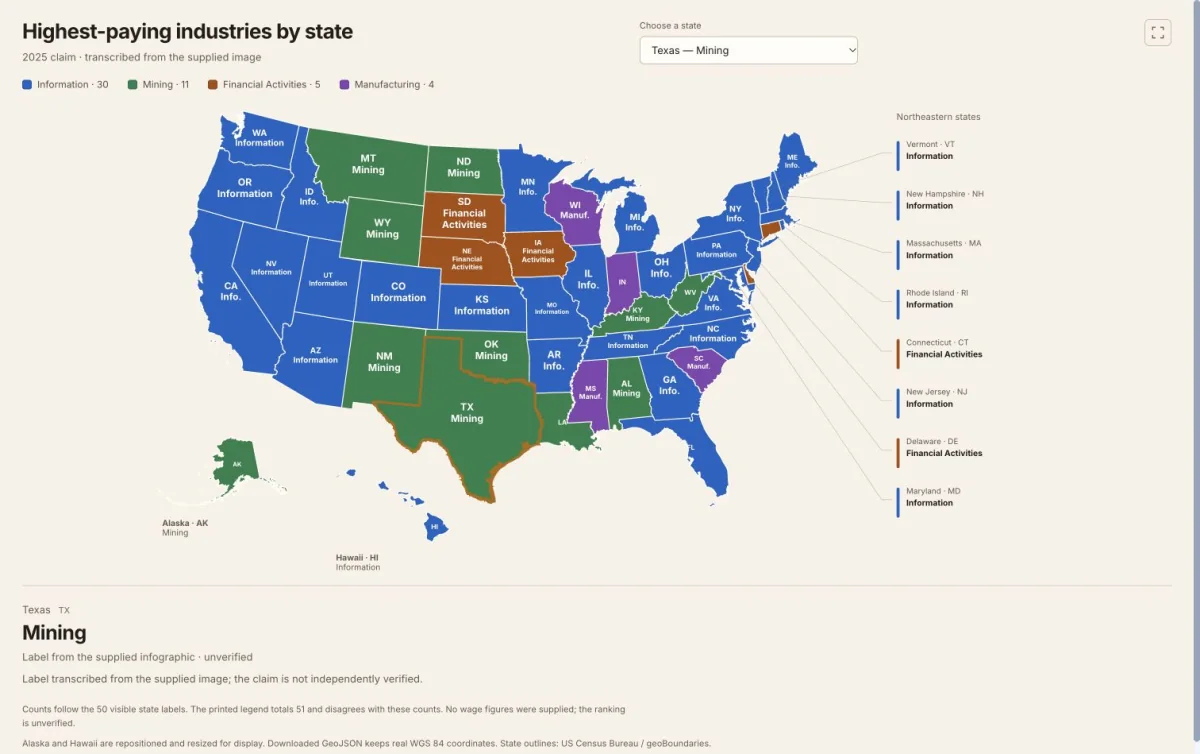
Actual dataset map screenshot. 50 state labels and four industry categories; printed ranking claims remain unverified. Labels transcribed from a supplied infographic; original artwork is not reused. State outlines: US Census Bureau / geoBoundaries. Captured 22 October 2026.
All 50 state records — industry label
Labels reproduce the supplied image. Missing labels remain empty in the downloadable files.
| State | Code | Industry label | Transcription status | Notes |
|---|---|---|---|---|
| Alaska | AK | Mining | Transcribed | — |
| Alabama | AL | Mining | Transcribed | — |
| Arkansas | AR | Information | Transcribed | — |
| Arizona | AZ | Information | Transcribed | — |
| California | CA | Information | Transcribed | — |
| Colorado | CO | Information | Transcribed | — |
| Connecticut | CT | Financial Activities | Transcribed | Label is shown in the right-side callout. |
| Delaware | DE | Financial Activities | Transcribed | Label is shown in the right-side callout. |
| Florida | FL | Information | Transcribed | — |
| Georgia | GA | Information | Transcribed | — |
| Hawaii | HI | Information | Transcribed | — |
| Iowa | IA | Financial Activities | Transcribed | — |
| Idaho | ID | Information | Transcribed | — |
| Illinois | IL | Information | Transcribed | — |
| Indiana | IN | Manufacturing | Transcribed | — |
| Kansas | KS | Information | Transcribed | — |
| Kentucky | KY | Mining | Transcribed | — |
| Louisiana | LA | Mining | Transcribed | — |
| Massachusetts | MA | Information | Transcribed | Label is shown in the right-side callout. |
| Maryland | MD | Information | Transcribed | Label is shown in the right-side callout. |
| Maine | ME | Information | Transcribed | — |
| Michigan | MI | Information | Transcribed | — |
| Minnesota | MN | Information | Transcribed | — |
| Missouri | MO | Information | Transcribed | — |
| Mississippi | MS | Manufacturing | Transcribed | — |
| Montana | MT | Mining | Transcribed | — |
| North Carolina | NC | Information | Transcribed | — |
| North Dakota | ND | Mining | Transcribed | — |
| Nebraska | NE | Financial Activities | Transcribed | — |
| New Hampshire | NH | Information | Transcribed | Label is shown in the right-side callout. |
| New Jersey | NJ | Information | Transcribed | Label is shown in the right-side callout. |
| New Mexico | NM | Mining | Transcribed | — |
| Nevada | NV | Information | Transcribed | — |
| New York | NY | Information | Transcribed | — |
| Ohio | OH | Information | Transcribed | — |
| Oklahoma | OK | Mining | Transcribed | — |
| Oregon | OR | Information | Transcribed | — |
| Pennsylvania | PA | Information | Transcribed | — |
| Rhode Island | RI | Information | Transcribed | Label is shown in the right-side callout. |
| South Carolina | SC | Manufacturing | Transcribed | — |
| South Dakota | SD | Financial Activities | Transcribed | — |
| Tennessee | TN | Information | Transcribed | — |
| Texas | TX | Mining | Transcribed | — |
| Utah | UT | Information | Transcribed | — |
| Virginia | VA | Information | Transcribed | — |
| Vermont | VT | Information | Transcribed | Label is shown in the right-side callout. |
| Washington | WA | Information | Transcribed | — |
| Wisconsin | WI | Manufacturing | Transcribed | — |
| West Virginia | WV | Mining | Transcribed | — |
| Wyoming | WY | Mining | Transcribed | — |
Transcribed means the label was readable in the image; it does not mean the claim was independently verified.
How to download
- 1 Click a state or use the state selector to read the full label and transcription notes.
- 2 Review the complete 50-state table, including missing labels and any source discrepancies.
- 3 Download GeoJSON for a polygon layer, or CSV for attributes joined using state_code or shapeISO.
- 4 Check the original claims against independent sources before using the labels as factual rankings or historical evidence.
FAQ
Is this an official BLS highest-paying-industry ranking?
No. This is a transcription of a user-supplied infographic. The image credits the U.S. Bureau of Labor Statistics, QCEW, 2025 annual averages, but does not provide a reproducible calculation or sufficiently detailed industry-selection method. That printed attribution and the rankings remain unverified.
Why do the map counts differ from the original legend?
The visible state labels total 50: Information 30, Mining 11, Manufacturing four and Financial Activities five. The image's legend says Information 29, Mining 13, Manufacturing five and Financial Activities four, totaling 51. The new map counts the individual state labels and retains the original legend claims in its GeoJSON metadata.
Does the dataset contain salaries or average annual pay?
No. The image gives categories without wage figures. The files retain the printed industry names and a claimed source year of 2025; they do not supply pay amounts or treat that year as a known publication date.
Can I use these files in GIS software?
The GeoJSON contains 50 state polygons in WGS 84, with original labels, label_status, verification and source notes. The CSV contains the same attributes without geometry; join it using state_code or shapeISO. Alaska and Hawaii are repositioned only in the page's SVG preview. The downloaded geometry retains real coordinates. Boundary geometry is public domain; the supplied infographic's label license is unspecified, and its artwork is not included.