2026 US Cropland Values by State — Map & Dataset
Quick answer: USDA NASS reports a 2026 US cropland value of $6,020 per acre, 3.3% above 2025. This map compares the published state average cropland values for the 48 contiguous states and retains Alaska and Hawaii as not surveyed. Download 50 state polygons or a 50-row CSV with 2022–2026 values and explicit data statuses.
About this dataset
Compare USDA NASS state average cropland values for 2022–2026, with a 2026 map and free GeoJSON or CSV downloads.
Explore state average cropland values from USDA NASS Land Values 2026 Summary, released July 31, 2026. The 2026 map has published values for all 48 contiguous states; Alaska and Hawaii remain visible as not surveyed. The source combines irrigated and nonirrigated cropland in its all-cropland estimates. Values are nominal US dollars per acre for 2022–2026, with an optional display in US dollars per hectare. They describe state averages, not the value of every parcel or point, and do not measure urban land, all land, cash rent or county-level prices. USDA's published US cropland value is $6,020 per acre in 2026, up 3.3% from 2025; it is a separate national estimate, not an unweighted average of the states. Arizona, Nevada, New Mexico and Utah exclude American Indian Reservation land as specified by the source.
Data source: USDA NASS — Land Values 2026 Summary
Attribution: USDA National Agricultural Statistics Service, Land Values 2026 Summary, July 31, 2026, Cropland Average Value per Acre table (2022–2026). USDA NASS information is in the public domain; cite USDA NASS when reusing it. Boundaries: US Census Bureau MAF/TIGER (2018), via geoBoundaries, simplified by GeoDataViewer; public domain. GeoDataViewer joins the published statistics to state polygons and derives USD per hectare using 1 acre = 0.40468564224 hectare. The preview repositions Alaska and Hawaii only for display; downloads retain real WGS 84 coordinates. Public Domain — USDA NASS statistics and US Census Bureau boundary geometry
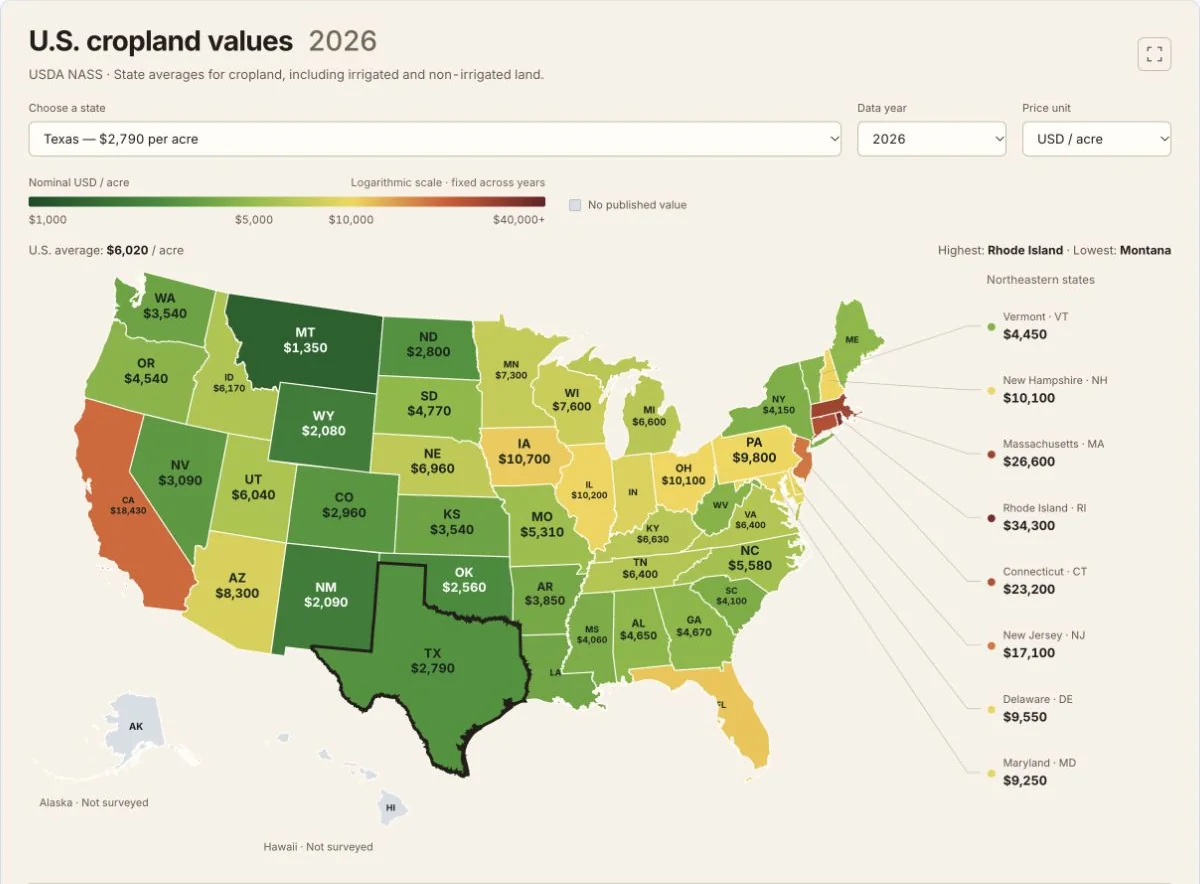
Actual SVG map of USDA NASS 2026 state average cropland values in nominal USD per acre; 48 published estimates, with Alaska and Hawaii not surveyed. A fixed logarithmic scale supports year comparisons. USDA NASS and US Census Bureau / geoBoundaries data are public domain. Captured 22 October 2026.
All 50 states — cropland value in nominal USD per acre
Values reproduce the 2022–2026 series in the 2026 USDA report. D means withheld to avoid disclosing data for individual operations; Alaska and Hawaii are not surveyed. Missing values remain null in downloads.
| State | Code | 2022 | 2023 | 2024 | 2025 | 2026 | 2025–2026 change | Source notes |
|---|---|---|---|---|---|---|---|---|
| Alabama | AL | 4,040 | 4,160 | 4,440 | 4,550 | 4,650 | 2.2% | — |
| Alaska | AK | Not surveyed | Not surveyed | Not surveyed | Not surveyed | Not surveyed | — | Not surveyed in this USDA NASS land-values series; Alaska and Hawaii are excluded. |
| Arizona | AZ | 7,900 | 8,000 | D — withheld | 8,150 | 8,300 | 1.8% | Excludes American Indian Reservation land. |
| Arkansas | AR | 3,330 | 3,460 | 3,600 | 3,720 | 3,850 | 3.5% | — |
| California | CA | 16,170 | 16,820 | 17,330 | 17,940 | 18,430 | 2.7% | — |
| Colorado | CO | 2,670 | 2,870 | 2,810 | 2,880 | 2,960 | 2.8% | — |
| Connecticut | CT | D — withheld | D — withheld | D — withheld | 22,700 | 23,200 | 2.2% | — |
| Delaware | DE | 8,980 | 9,230 | D — withheld | 9,300 | 9,550 | 2.7% | — |
| Florida | FL | 8,340 | 9,290 | 10,170 | 10,550 | 11,100 | 5.2% | — |
| Georgia | GA | 3,760 | 4,120 | 4,330 | 4,520 | 4,670 | 3.3% | — |
| Hawaii | HI | Not surveyed | Not surveyed | Not surveyed | Not surveyed | Not surveyed | — | Not surveyed in this USDA NASS land-values series; Alaska and Hawaii are excluded. |
| Idaho | ID | 5,330 | 5,650 | 5,820 | 6,050 | 6,170 | 2.0% | — |
| Illinois | IL | 8,700 | 9,250 | 9,550 | 9,850 | 10,200 | 3.6% | — |
| Indiana | IN | 7,170 | 7,620 | 7,870 | 8,250 | 8,600 | 4.2% | — |
| Iowa | IA | 8,830 | 9,410 | 9,800 | 10,300 | 10,700 | 3.9% | — |
| Kansas | KS | 2,710 | 3,080 | 3,300 | 3,440 | 3,540 | 2.9% | — |
| Kentucky | KY | 5,200 | 5,720 | 6,220 | 6,450 | 6,630 | 2.8% | — |
| Louisiana | LA | 3,250 | 3,330 | 3,480 | 3,570 | 3,660 | 2.5% | — |
| Maine | ME | D — withheld | D — withheld | D — withheld | 4,600 | 4,700 | 2.2% | — |
| Maryland | MD | 8,430 | 8,540 | 8,770 | 8,990 | 9,250 | 2.9% | — |
| Massachusetts | MA | D — withheld | D — withheld | D — withheld | 26,000 | 26,600 | 2.3% | — |
| Michigan | MI | 4,960 | 5,420 | 5,870 | 6,350 | 6,600 | 3.9% | — |
| Minnesota | MN | 5,830 | 6,310 | 6,540 | 7,000 | 7,300 | 4.3% | — |
| Mississippi | MS | 3,610 | 3,760 | 3,880 | 3,960 | 4,060 | 2.5% | — |
| Missouri | MO | 4,400 | 4,720 | 4,910 | 5,150 | 5,310 | 3.1% | — |
| Montana | MT | 1,250 | 1,290 | 1,280 | 1,320 | 1,350 | 2.3% | — |
| Nebraska | NE | 5,520 | 6,150 | 6,540 | 6,800 | 6,960 | 2.4% | — |
| Nevada | NV | D — withheld | D — withheld | D — withheld | 3,030 | 3,090 | 2.0% | Excludes American Indian Reservation land. |
| New Hampshire | NH | D — withheld | D — withheld | D — withheld | 9,900 | 10,100 | 2.0% | — |
| New Jersey | NJ | 14,700 | 16,400 | 16,300 | 16,700 | 17,100 | 2.4% | — |
| New Mexico | NM | 1,930 | 1,990 | 2,000 | 2,020 | 2,090 | 3.5% | Excludes American Indian Reservation land. |
| New York | NY | 3,400 | 3,630 | 3,850 | 4,010 | 4,150 | 3.5% | — |
| North Carolina | NC | 4,650 | 4,800 | 5,120 | 5,360 | 5,580 | 4.1% | — |
| North Dakota | ND | 2,200 | 2,450 | 2,600 | 2,710 | 2,800 | 3.3% | — |
| Ohio | OH | 7,740 | 8,450 | 9,270 | 9,750 | 10,100 | 3.6% | — |
| Oklahoma | OK | 1,940 | 2,130 | 2,310 | 2,470 | 2,560 | 3.6% | — |
| Oregon | OR | 3,940 | 4,090 | 4,350 | 4,440 | 4,540 | 2.3% | — |
| Pennsylvania | PA | 8,650 | 9,080 | 9,270 | 9,560 | 9,800 | 2.5% | — |
| Rhode Island | RI | D — withheld | D — withheld | D — withheld | 32,900 | 34,300 | 4.3% | — |
| South Carolina | SC | 3,370 | 3,600 | 3,800 | 4,000 | 4,100 | 2.5% | — |
| South Dakota | SD | 3,710 | 4,100 | 4,350 | 4,610 | 4,770 | 3.5% | — |
| Tennessee | TN | 4,590 | 5,060 | 5,610 | 6,050 | 6,400 | 5.8% | — |
| Texas | TX | 2,360 | 2,490 | 2,570 | 2,710 | 2,790 | 3.0% | — |
| Utah | UT | 4,680 | 4,870 | 5,280 | 5,790 | 6,040 | 4.3% | Excludes American Indian Reservation land. |
| Vermont | VT | D — withheld | D — withheld | D — withheld | 4,350 | 4,450 | 2.3% | — |
| Virginia | VA | 5,100 | 5,490 | 5,930 | 6,170 | 6,400 | 3.7% | — |
| Washington | WA | 3,180 | 3,300 | 3,410 | 3,480 | 3,540 | 1.7% | — |
| West Virginia | WV | 3,700 | 3,920 | 4,050 | 4,220 | 4,400 | 4.3% | — |
| Wisconsin | WI | 5,940 | 6,620 | 6,800 | 7,250 | 7,600 | 4.8% | — |
| Wyoming | WY | 1,850 | 1,940 | 1,960 | 2,000 | 2,080 | 4.0% | — |
Not adjusted for inflation. All cropland combines irrigated and nonirrigated cropland. Arizona, Nevada, New Mexico and Utah exclude American Indian Reservation land. State boundaries do not depict ownership or the footprint of surveyed cropland.
Published US cropland reference — nominal USD per acre
These national values come directly from USDA NASS and are not calculated by averaging the state records.
| 2022 | 2023 | 2024 | 2025 | 2026 | 2025–2026 change |
|---|---|---|---|---|---|
| 4,940 | 5,320 | 5,570 | 5,830 | 6,020 | 3.3% |
The report's national estimate covers the 48 contiguous states. Monetary values are nominal; the national reference is separate from the map's lowest and highest state values.
Download field documentation
| Field | Meaning |
|---|---|
| state / state_code / shapeISO | State name, two-letter state code and ISO 3166-2 join code (for example, California / CA / US-CA). |
| cropland_usd_per_acre_YYYY | USDA NASS published state average all-cropland value in nominal USD per acre for YYYY, 2022–2026; null when withheld or not surveyed. |
| cropland_usd_per_hectare_YYYY | Derived USD per hectare: the USD-per-acre value divided by 0.40468564224; null when the source value is null. Conversion does not add source precision. |
| status_YYYY | published, withheld (the report's D marker), or not_surveyed (Alaska and Hawaii). Read this field before interpreting a null monetary value. |
| value_2026 | Default map value in nominal USD per acre; identical to cropland_usd_per_acre_2026. |
| published_2026 | 1 when the 2026 state value is published; 0 when it is withheld or not surveyed. |
| change_2025_2026_pct | Percent change published in the report for 2025–2026; null when unavailable. It retains the source's rounding. |
| excludes_reservation_land | 1 for Arizona, Nevada, New Mexico and Utah, whose cropland values exclude American Indian Reservation land; 0 for other states. This is a statistical footnote, not an ownership boundary layer. |
| notes | State-specific source exclusions or missing-data notes. |
| publication_date / source_url | Report publication date and official USDA NASS source citation. |
GeoJSON stores WGS 84 geometry; CSV stores attributes only. The page's Alaska and Hawaii insets do not alter the downloaded coordinates.
How to download
- 1 Choose a year from 2022 to 2026 and a unit, then select a state to inspect its value and source notes.
- 2 Read the full state table and distinguish withheld D values from the not-surveyed Alaska and Hawaii records.
- 3 Download GeoJSON for real WGS 84 polygons, or CSV for attributes joined using state_code or shapeISO.
- 4 Use the USDA report for methodology and cite USDA NASS, Land Values 2026 Summary, July 31, 2026.
Download GeoJSON — 50 state polygons
Real WGS 84 geometry with 2022–2026 values, statuses, source notes and default 2026 styling
Download CSV — 50 state records
The same attributes without geometry; join using state_code (CA) or shapeISO (US-CA)
USDA NASS 2026 source report
Original plain-text report, including survey methods, table footnotes and published national estimates
FAQ
What does this 2026 cropland value map measure?
It maps USDA NASS state average all-cropland values in nominal US dollars per acre. All cropland combines irrigated and nonirrigated cropland. The source is Land Values 2026 Summary, published July 31, 2026, with values for 2022–2026. It is not a parcel appraisal, county-level price map, rent map or estimate of all types of land.
What is the 2026 US average cropland value?
USDA NASS publishes $6,020 per acre for US cropland in 2026, a 3.3% increase from 2025. This is the report's national estimate for the 48 contiguous states. GeoDataViewer displays that published figure rather than calculating an unweighted average of state values.
Why are Alaska and Hawaii gray, and what does D mean?
Alaska and Hawaii are not included in this survey and retain null values with status not_surveyed for every year. D is a different source status: a value was withheld to avoid disclosing data for individual operations. Those cells retain null with status withheld; no missing values are estimated. All 48 contiguous states have published values in 2026.
Are the values adjusted for inflation, and how are hectares calculated?
The published USD-per-acre values are nominal and are not adjusted for inflation. USD per hectare is a derived unit conversion: divide USD per acre by 0.40468564224, the exact hectare area of an international acre. This changes the area unit, not the underlying estimate or its precision.
Does the map show land ownership or reservation boundaries?
No. The polygons are state boundaries used to display state averages. The USDA footnote says Arizona, Nevada, New Mexico and Utah cropland values exclude American Indian Reservation land. The dataset preserves that exclusion as a flag and note; it does not draw a reservation, federal-land or private-ownership layer, and a state color does not imply a value at every location.
Can I download and reuse the data in GIS software?
Yes. Download GeoJSON with 50 state polygons in real WGS 84 coordinates, or the same 50 records as CSV and join by state_code or shapeISO. The files include all five years, explicit status fields and source notes. USDA NASS statistics and the US Census Bureau boundary geometry are public domain. Cite USDA National Agricultural Statistics Service, Land Values 2026 Summary, July 31, 2026, and retain the boundary attribution.