2022 US Farmland Values by County — Land & Buildings Map
Quick answer: This map shows 2022 USDA Census of Agriculture county average agricultural land and building values in USD per acre. Download 3,079 NASS statistical county areas: 3,072 published values, 6 withheld and 1 unavailable. Buildings are included; these are county averages, not parcel appraisals or cropland-only prices.
About this dataset
Explore USDA 2022 Census of Agriculture county average agricultural land and building values, with free GeoJSON and CSV downloads.
Map the 2022 Census of Agriculture snapshot of county average agricultural land and building asset values in nominal US dollars per acre. The USDA NASS Quick Stats series is AG LAND, INCL BUILDINGS - ASSET VALUE, MEASURED IN $ / ACRE, reported at the end of December 2022. It covers agricultural land including buildings, rather than cropland alone. These county averages describe farm real estate, not individual parcels, sale prices, cash rent or all land in a county. NASS statistical county areas are used for the geographic join; they include combined reporting areas and do not reproduce every modern political county separately. Published values, withheld figures and unavailable records remain distinct. The optional USD-per-hectare display is a unit conversion of the same source measure.
Data source: USDA NASS — 2022 Census of Agriculture / Quick Stats
Attribution: USDA National Agricultural Statistics Service, 2022 Census of Agriculture, Quick Stats: AG LAND, INCL BUILDINGS - ASSET VALUE, MEASURED IN $ / ACRE (county level, end of December 2022). Boundaries: USDA NASS, 2022 Census of Agriculture, Ag Census Web Maps; generalized US Census Bureau boundaries modified by NASS to match agricultural statistical reporting areas. USDA NASS information is public domain; acknowledge USDA NASS when reusing it. GeoDataViewer joins source records by county FIPS, preserves source suppression and missing values, and derives USD per hectare using 1 acre = 0.40468564224 hectare. Downloads retain real WGS 84 coordinates; any preview insets are display-only. Public Domain — USDA NASS statistics and Census-derived boundary geometry
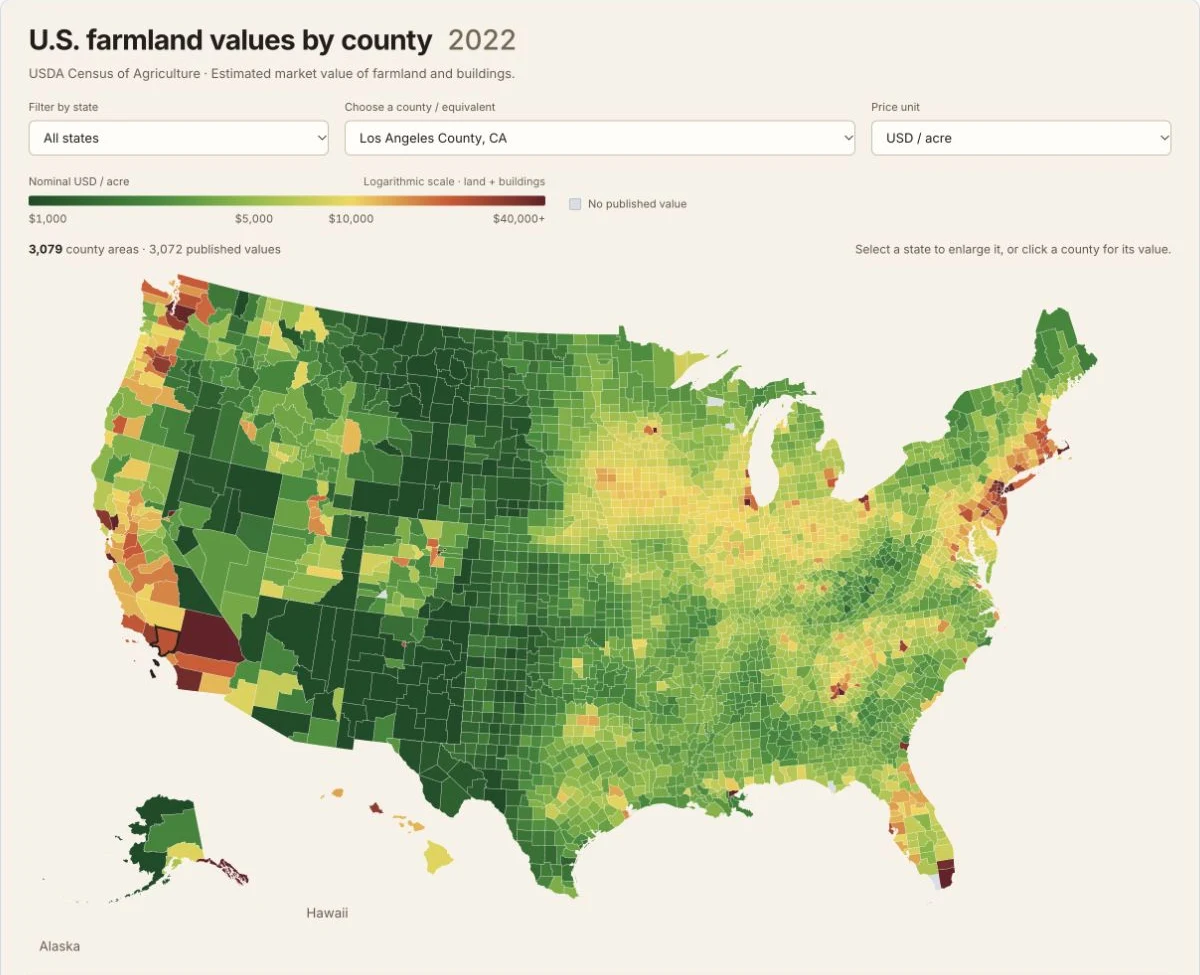
Actual SVG map of 2022 USDA Census of Agriculture county average farmland and building values in nominal USD per acre. Includes 3,079 NASS county areas: 3,072 published, six withheld and one unavailable. USDA NASS statistics and generalized county boundaries are public domain. Captured 22 October 2026.
20 highest published county averages — land and buildings
Ranked by the published 2022 asset value in nominal USD per acre. Suppressed and unavailable records are excluded from this comparison.
| County reporting area | State | County FIPS | USD/acre | USD/hectare |
|---|---|---|---|---|
| Richmond County, New York | NY | 36085 | 2,551,600 | 6,305,140.91 |
| Kings County, New York | NY | 36047 | 588,578 | 1,454,407.91 |
| Essex County, New Jersey | NJ | 34013 | 471,343 | 1,164,713.92 |
| Hudson County, New Jersey | NJ | 34017 | 256,000 | 632,589.78 |
| Bergen County, New Jersey | NJ | 34003 | 188,137 | 464,896.65 |
| Arlington County, Virginia | VA | 51013 | 150,000 | 370,658.07 |
| Denver County, Colorado | CO | 08031 | 122,408 | 302,476.76 |
| Queens County, New York | NY | 36081 | 113,746 | 281,072.49 |
| Union County, New Jersey | NJ | 34039 | 105,823 | 261,494.33 |
| DeKalb County, Georgia | GA | 13089 | 99,639 | 246,213.33 |
| Juneau Area, Alaska | AK | 02110 | 87,733 | 216,792.96 |
| Storey County, Nevada | NV | 32029 | 77,197 | 190,757.94 |
| Philadelphia County, Pennsylvania | PA | 42101 | 77,080 | 190,468.83 |
| Nassau County, New York | NY | 36059 | 62,463 | 154,349.43 |
| Napa County, California | CA | 06055 | 61,295 | 151,463.24 |
| Barnstable County, Massachusetts | MA | 25001 | 58,917 | 145,587.08 |
| DuPage County, Illinois | IL | 17043 | 57,683 | 142,537.8 |
| Suffolk County, Massachusetts | MA | 25025 | 52,340 | 129,334.96 |
| Kitsap County, Washington | WA | 53035 | 50,663 | 125,191 |
| Miami-Dade County, Florida | FL | 12086 | 50,161 | 123,950.53 |
Buildings are included. A high county average is not a parcel appraisal or a recorded land sale price. Values are not adjusted for inflation.
County map coverage and data availability
| Record type | Count | Interpretation |
|---|---|---|
| NASS county reporting areas | 3,079 | Geographic areas in the download, including combined statistical areas. |
| Published | 3,072 | A numeric USD-per-acre value is available from the selected source series. |
| Withheld | 6 | USDA D suppression marker; the monetary fields remain null. |
| Unavailable | 1 | No usable value from the selected source series; monetary fields remain null. |
No suppression is reverse-engineered and no missing values are imputed. NASS reporting areas can combine counties and independent cities, so county_fips must be joined to matching NASS geography.
Download field documentation
| Field | Meaning |
|---|---|
| name / county / state / state_code | Display name, NASS county reporting-area name, state name and two-letter state code. |
| county_fips | Five-character state-and-county reporting-area code. Retain leading zeros and use the matching NASS boundary definitions. |
| value_usd_per_acre | Published 2022 county average agricultural land and building asset value, in nominal USD per acre; null for withheld or unavailable data. |
| value_usd_per_hectare | Derived USD per hectare: value_usd_per_acre divided by 0.40468564224. This conversion adds no source precision; null when the acre value is null. |
| data_status | published, withheld (USDA D marker), or not_available. Missing and suppressed values are never converted to zero. |
| raw_value | Original USDA Quick Stats value, including its source suppression marker where present. |
| source_short_desc | Exact selected series: AG LAND, INCL BUILDINGS - ASSET VALUE, MEASURED IN $ / ACRE. |
| year / source_url | 2022 Census reference year and official source citation. |
| notes | Suppression, missing-data and reporting-area qualifications for the record. |
| fill | Default map color; styling has no effect on the source value or data status. |
GeoJSON supplies generalized geometry in WGS 84. CSV contains the same attribute fields without geometry. Preview insets do not change downloaded coordinates.
How to download
- 1 Select a county area to inspect its 2022 value, source status and notes; switch between USD per acre and USD per hectare if useful.
- 2 Read the status before interpreting a gray county: withheld and unavailable records are different, and neither is a zero value.
- 3 Download GeoJSON for real WGS 84 geometry, or CSV for attributes. Join county_fips to the matching NASS reporting-area boundaries.
- 4 Cite USDA NASS, 2022 Census of Agriculture / Quick Stats, and retain the Ag Census Web Maps boundary attribution.
Download GeoJSON — 3,079 county areas
Real WGS 84 polygons, source values, explicit statuses and source notes
Download CSV — 3,079 county records
The same attributes without geometry; preserve county_fips as a five-character string when joining
USDA Quick Stats 2022 Census bulk source
Original compressed tab-delimited Census data; the export selects the exact county land-and-building value series
USDA county boundaries and geographic metadata
Official 2022 Ag Census Web Maps overview and boundary downloads
USDA Ag Census data documentation
Source documentation for the 2022 Ag Census Web Maps
FAQ
What does the 2022 county farmland value map measure?
The exact USDA Quick Stats series is AG LAND, INCL BUILDINGS - ASSET VALUE, MEASURED IN $ / ACRE, from the 2022 Census of Agriculture at the end of December. It measures county average agricultural land and building asset values in nominal US dollars per acre. It includes buildings and agricultural land beyond cropland.
How is this different from the 2026 cropland values by state map?
The state map uses the annual USDA Land Values survey and measures cropland only. This county map uses the 2022 Census of Agriculture and includes agricultural land and buildings. Their years, geographic levels and measures differ, so their values should not be treated as directly comparable estimates of the same thing.
Does a county color show the price of every property?
No. The map assigns a county reporting-area average to its boundary. It does not map individual farms, ownership, parcels, recent sales or cash rent, and it does not value urban or other nonagricultural land.
What do withheld and unavailable mean?
Withheld preserves USDA's D confidentiality marker. Unavailable means that the selected source series has no usable value for the reporting area. Both retain null monetary fields and explicit data_status values. They are not zero values, and GeoDataViewer does not estimate them.
Why do these boundaries differ from modern county maps?
The download uses the NASS 2022 Ag Census statistical county areas. NASS adapted generalized Census boundaries for its reporting geography, including combined areas. A county FIPS join should therefore use these matching reporting areas; a modern political county file may not have a one-to-one match.
Are values adjusted for inflation, and how are hectares calculated?
These are nominal 2022 US dollars, without an inflation adjustment. USD per hectare is calculated by dividing the USDA USD-per-acre value by 0.40468564224, the exact number of hectares in an international acre. Changing the unit does not add precision to the published estimate.
Can I reuse the county GeoJSON and CSV?
Yes. Download 3,079 reporting-area polygons as GeoJSON in real WGS 84 coordinates or the same attributes as CSV. USDA NASS statistics and the Census-derived boundaries are public domain. Acknowledge USDA National Agricultural Statistics Service, 2022 Census of Agriculture / Quick Stats, and the Ag Census Web Maps boundary source.