A map titled “Your Chances of Being Born Here—2026” divides the world into two colors, marked 51% and 49%. It raises a compelling question: how unevenly are new lives distributed across the planet? But without a source, an explicit country list, or a calculation method, its percentages cannot be verified.
Rather than reproduce its conclusion, we rebuilt the analysis using World Bank data for 2024, with 2000 as a historical comparison. The resulting geography reveals several apparent contradictions: low-fertility countries still account for almost half of births; Japan has a higher crude death rate than Ethiopia despite much longer life expectancy; and a country can record more deaths than births while its population grows.
These patterns make sense once we distinguish three things: population scale, demographic behavior, and age structure. The six original maps and charts below separate those effects instead of compressing them into a single red-and-green divide.
1. Ten countries account for roughly half of births
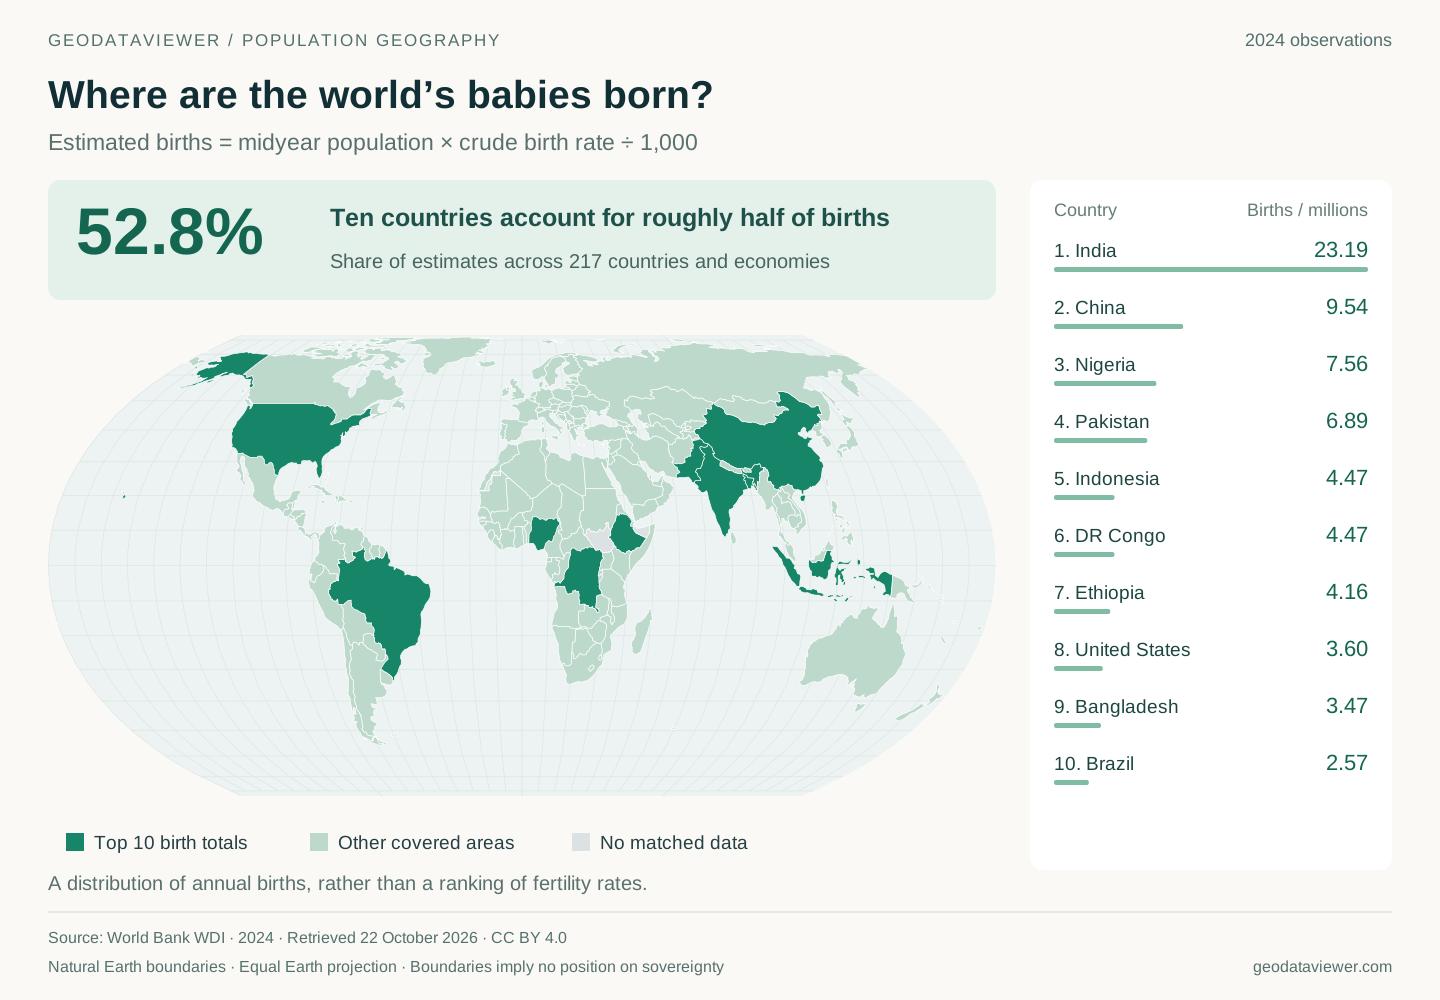
Across 217 countries and economies with matching observations, multiplying population by the crude birth rate produces approximately 132.3 million estimated births. Ten countries account for 52.8% of that total. India contributes about 23.19 million, China 9.54 million, and Nigeria 7.56 million. These are our calculations from World Bank population and crude birth-rate data, rather than a direct sum of registered births.
India alone accounts for about 17.5% of covered births—roughly one in six. That is a statement about a specific annual flow. If we randomly select a baby from those born in the covered population during 2024, the country’s share gives the probability of selecting a birth there. Selecting a random living person would answer a different question, because today’s population contains many generations shaped by past births, deaths and migration.
Land area provides little guidance. Canada and Russia occupy enormous spaces, but large territory does not automatically produce large birth cohorts. Conversely, South Asia occupies a relatively compact area while contributing a substantial share of births. An equal-area projection preserves the relative size of land, not the relative size of populations. That is why the map includes a numerical ranking: colored square kilometers cannot substitute for people.
The United States and Brazil also appear in the top ten. Birth concentration is therefore not simply a map of the countries with the highest fertility.
2. Higher fertility can coexist with fewer births
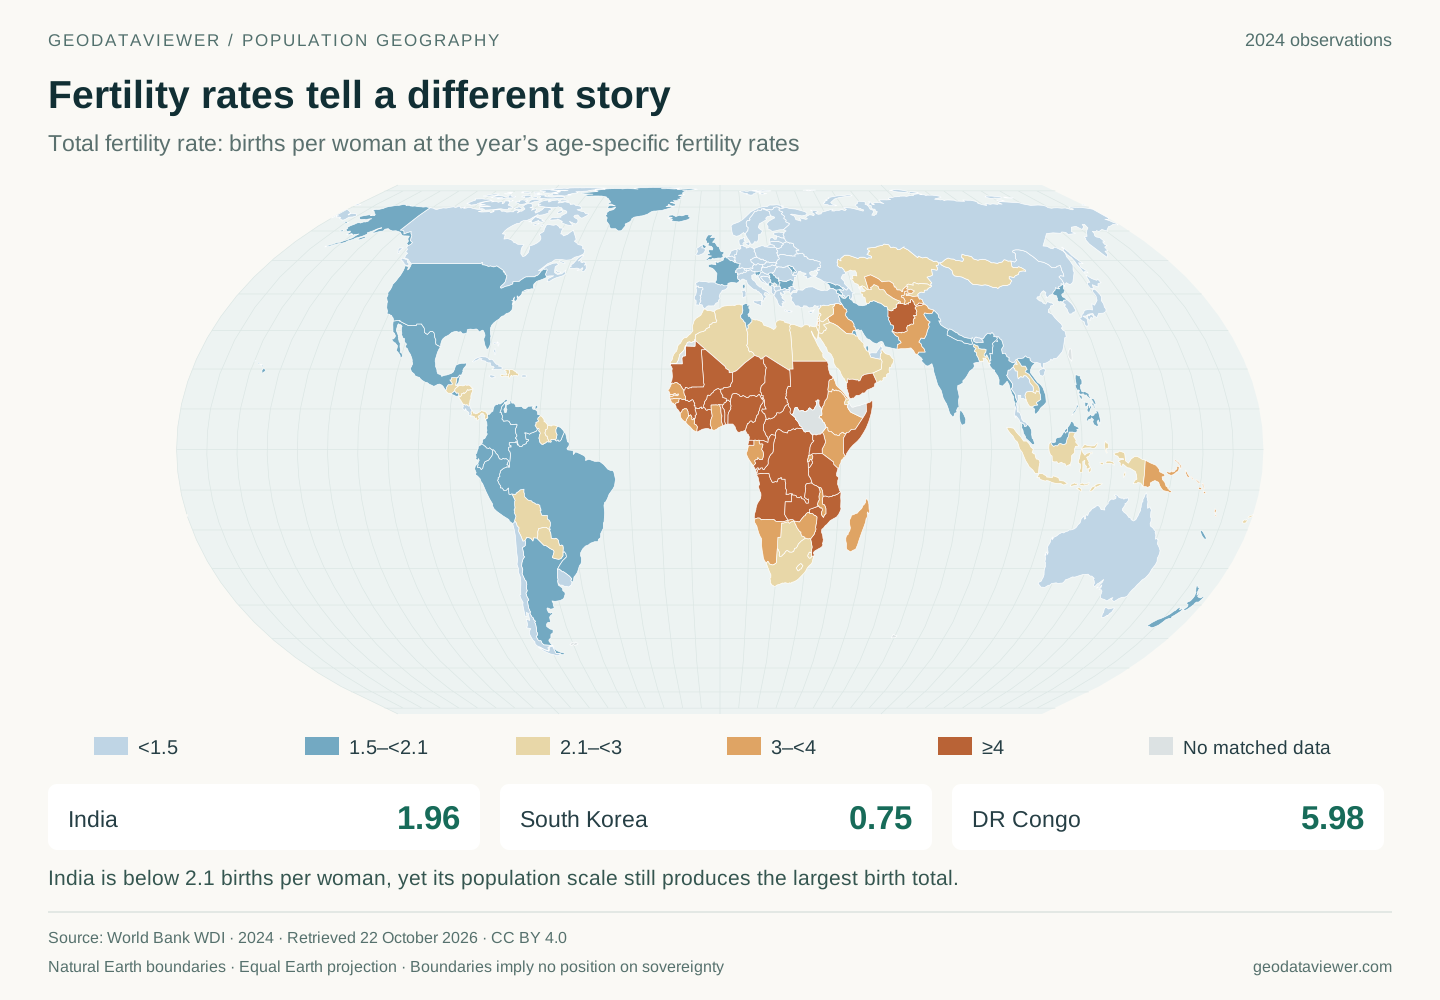
The crude birth rate measures annual live births per 1,000 residents. The total fertility rate, or TFR, adds together the year’s age-specific fertility rates to describe how many children a hypothetical woman would have if she experienced those rates throughout her reproductive life. It is a period measure, not an observation of how many children an actual generation ultimately has. World Bank fertility definition
China illustrates the difference between a rate and a total. Its 2024 TFR is about 1.01, compared with 4.38 in Nigeria. Nigeria’s fertility is more than four times as high, yet China’s estimated annual birth total is larger. India’s TFR, around 1.96, is far below DR Congo’s 5.98, but India produces more than five times as many estimated births.
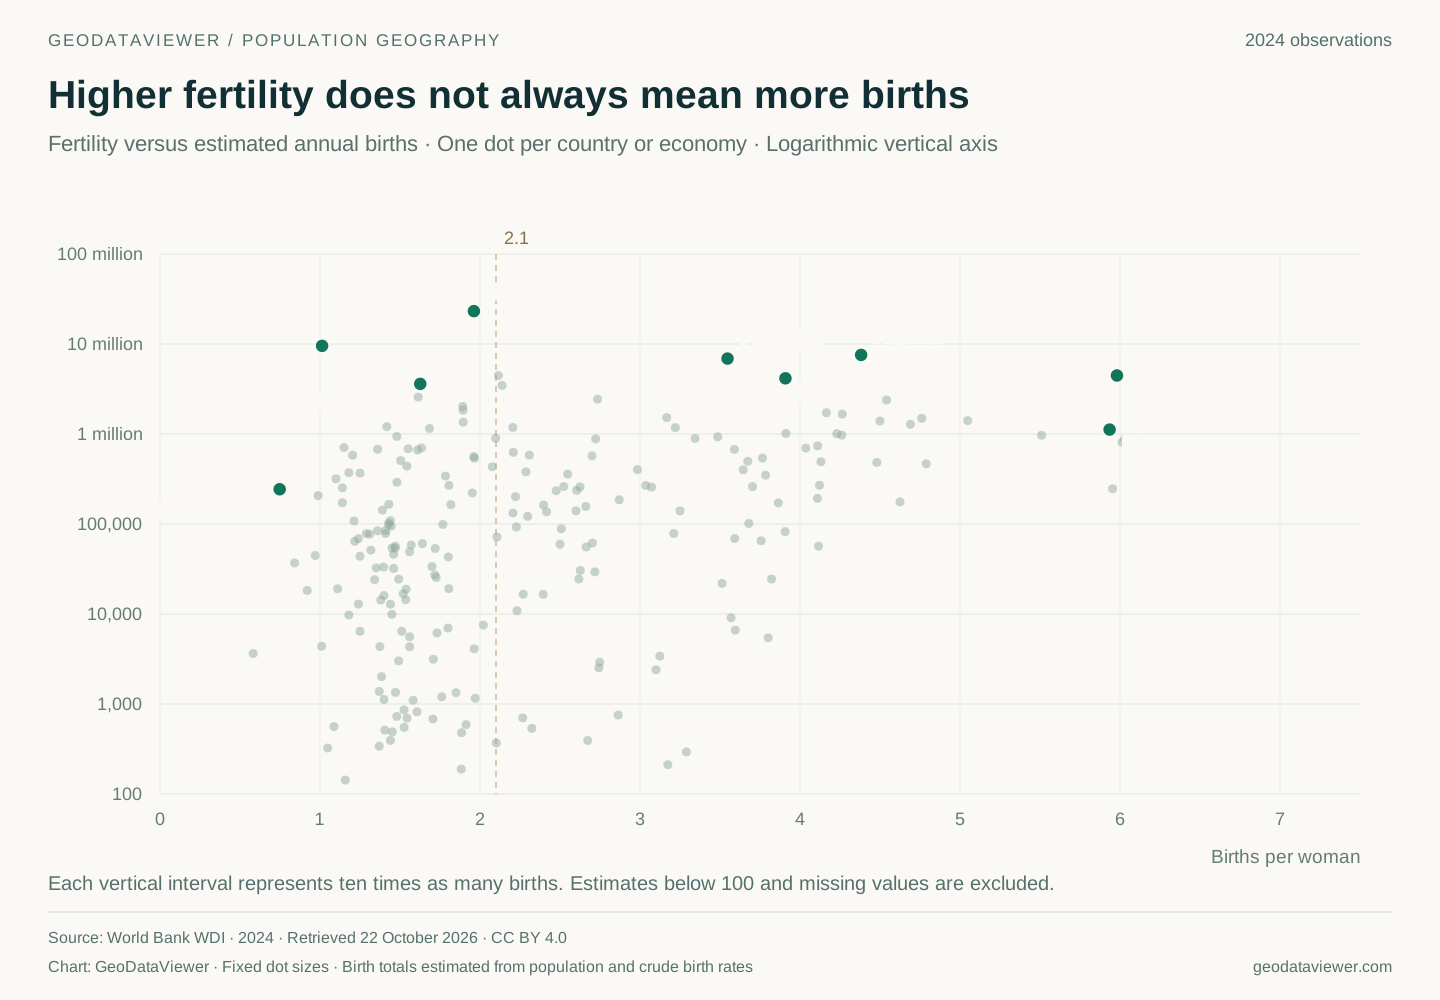
More precisely, births are the sum, across reproductive ages, of the number of women at each age multiplied by the corresponding fertility rate. Two populations can have the same TFR and very different birth totals because their size and distribution of women across ages differ.
The scatterplot uses a logarithmic vertical axis: each major step represents ten times as many births. It makes small and large populations visible together, but a modest vertical distance can conceal a substantial numerical difference.
This distinction also explains why a rising fertility rate does not guarantee rising births. If the number of women reaching reproductive ages is shrinking, a modest increase in births per woman may be outweighed by the smaller population exposed to those rates.
3. Nearly half of births occur where fertility is below 2.1
Grouping the same 217 countries and economies by their 2024 fertility rates produces a less obvious result:
| Total fertility rate | Countries and economies | Share of population | Share of estimated births | Share of estimated deaths |
|---|---|---|---|---|
| Below 2.1 | 119 | 67.4% | 45.8% | 70.1% |
| 2.1 to below 4 | 73 | 21.1% | 29.3% | 17.4% |
| 4 or more | 25 | 11.5% | 24.9% | 12.5% |
These shares are independently calculated from the frozen observations; the calculation summary provides the denominators and group membership. Births and deaths are estimated from population and their respective crude rates. Percentages describe the covered sample, not an unqualified census of every birth or death worldwide.
Two findings stand out. First, the countries below 2.1 still contribute 45.8% of births. Low fertility does not make their newborn populations negligible: many are very populous. Second, countries at four or more births per woman account for 11.5% of population but 24.9% of births—more than twice their population share.
The geography of the next generation consequently differs from the geography of everyone alive today. If a group’s birth share exceeds its population share, it is disproportionately represented among newborns. Whether that becomes a larger share of future adults also depends on survival and migration.
The death column tells a different story again: the below-2.1 group accounts for 70.1% of estimated deaths. This is a descriptive association, not evidence that low fertility causes poor health. Its members contain much of the world’s population, and their age structures vary. A demographic grouping cannot replace an analysis of age-specific mortality.
The familiar 2.1 is a common replacement-level approximation under low mortality, not a universal threshold for every population. Sex ratios and survival affect the actual requirement. Here it is a transparent grouping boundary, not a claim that populations immediately start shrinking when TFR crosses it.
4. High-fertility countries are changing—and populations have memory
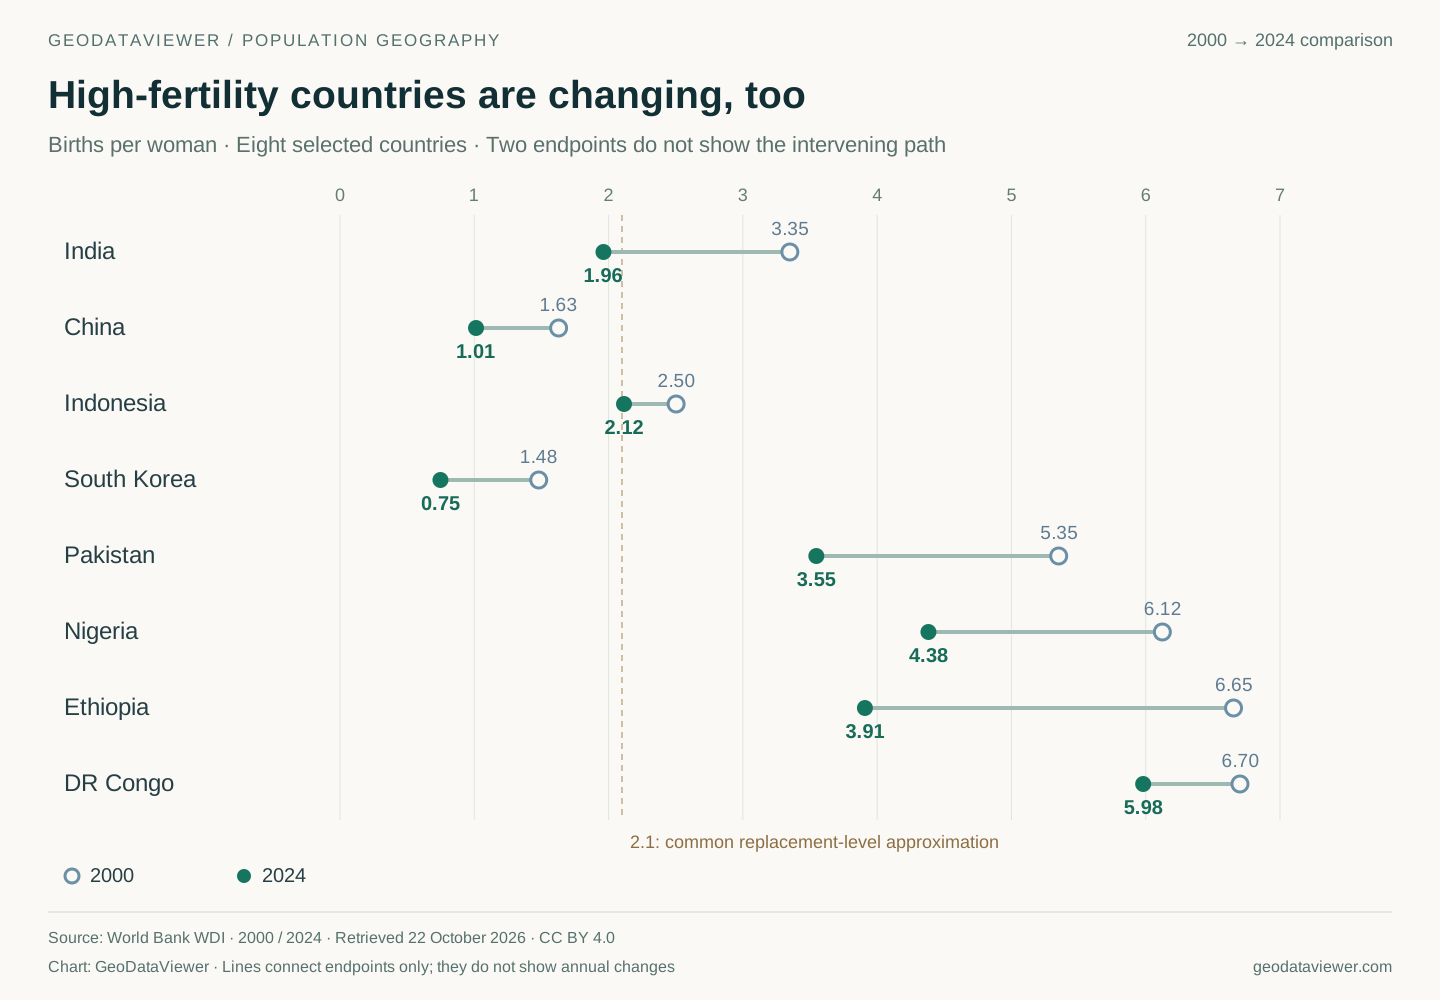
Between 2000 and 2024, Nigeria’s TFR fell from about 6.12 to 4.38; Ethiopia’s from 6.65 to 3.91; Pakistan’s from 5.35 to 3.55; and India’s from 3.35 to 1.96. All four declined, but they ended at very different levels. The endpoint chart does not imply an uninterrupted decline in every intervening year. World Bank historical fertility series
A label such as “high fertility” therefore describes a position at a particular time, not a permanent national characteristic. Falling fertility and continued population growth can coexist because behavior changes faster than the entire age distribution turns over.
This is population momentum. A large generation of children eventually becomes a large generation of potential parents. Even when each person has fewer children, the number entering reproductive ages can sustain substantial birth totals. The reverse can occur in an older population: smaller generations reaching adulthood constrain future births even if fertility improves. The UN’s World Population Prospects 2024 explicitly examines these effects of inherited age structure.
The contrast is visible in the World Bank’s 2024 age-composition data: children aged 0–14 account for about 46.0% of DR Congo’s population, 24.6% of India’s and 11.4% of Japan’s. Those differences do not determine an exact future, but they already imply different needs for schools, housing and eventual employment.
There is also a timing effect. Imagine people postponing a planned birth from age 28 to 30. Births fall during the transition even if some eventually have the same number of children. Period fertility can therefore decline because births happen later, because people ultimately have fewer children, or both.
Postponement does not guarantee a later rebound. OECD evidence using timing-adjusted fertility measures indicates that declines in some countries extend beyond delayed childbearing. Understanding the change requires examining birth timing, birth order and completed fertility across actual generations, rather than treating one year’s TFR as a lifetime verdict. OECD fertility indicators
5. Why Japan can have a higher death rate and longer lives
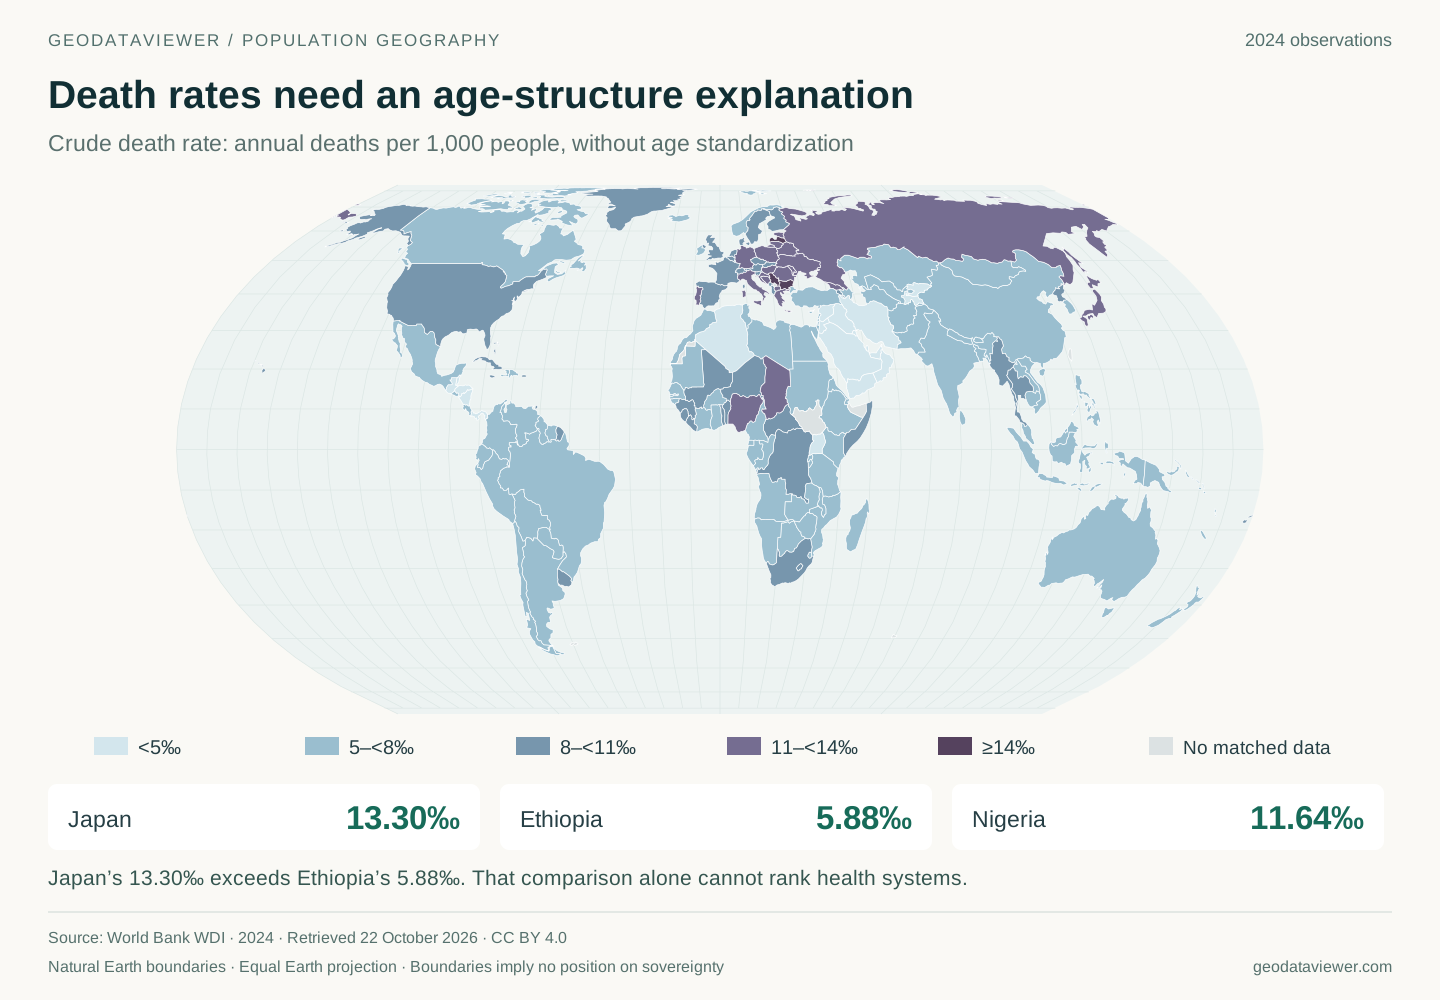
Japan’s crude death rate is about 13.30 per 1,000 people, compared with 5.88 in Ethiopia. Read alone, that might suggest worse health in Japan. Adding age structure and survival indicators changes the interpretation:
| Country | Crude deaths per 1,000 people | Population aged 65+ | Life expectancy at birth | Infant mortality per 1,000 live births |
|---|---|---|---|---|
| Japan | 13.30 | 29.8% | 84.0 years | 1.8 |
| Ethiopia | 5.88 | 3.2% | 67.6 years | 34.5 |
| Nigeria | 11.64 | 3.0% | 54.6 years | 69.8 |
All observations refer to 2024. Sources: crude death rates, older population shares, life expectancy, and infant mortality. Infant mortality uses live births as its denominator; it cannot be subtracted from the crude death rate.
Nearly three in ten Japanese residents are at least 65, compared with roughly three in a hundred Ethiopians. Because mortality risks generally rise at older ages, a population with more older residents can have a higher overall death rate despite favorable survival conditions.
A hypothetical calculation isolates the mechanism. Suppose a younger group has mortality of 1 per 1,000 and an older group 40 per 1,000. With 10% in the older group, the combined rate is 4.9. With 30% in that group, it is 12.7. Neither group’s mortality risk changed; only the population weights did. This is an illustration, not a fitted model of either country.
Youth alone does not guarantee good health, either. Nigeria and Ethiopia both have small older populations, but their crude death rates and infant mortality differ considerably. Age structure explains part of the international pattern, while health conditions still require separate investigation.
For comparisons, age-standardized mortality applies common age weights, helping remove that structural difference. It should be considered alongside life expectancy and child mortality. Crude death rates remain useful for understanding actual death volumes and service requirements, but cannot independently rank health systems. WHO age-standardization methodology
6. Better survival can accompany more deaths
Annual deaths are approximately population multiplied by the crude death rate. Three changes can therefore interact: falling mortality risks at particular ages, a growing total population, and more people reaching older ages. The latter two can outweigh the first, producing more deaths even as people become healthier and live longer.
An increase in deaths, by itself, does not establish deteriorating health. Likewise, a falling death rate needs interpretation: has the age distribution changed, and has the measure been standardized? Assessing a health shock requires an appropriate expected-deaths baseline, rather than assuming last year’s unadjusted count is always the right comparison.
Life expectancy is often misunderstood too. Japan’s figure of 84 years is neither the average age of everyone who died that year nor a promise about a particular baby’s future. It describes a hypothetical life exposed to the year’s age-specific mortality conditions. Like TFR, it assembles a synthetic lifetime from a single period’s rates. World Bank life-expectancy definition
A society can therefore achieve longer lives while experiencing growing demand for end-of-life care. That combination may reflect the success of survival improvements as well as the challenges of aging.
7. More deaths than births does not always mean population decline
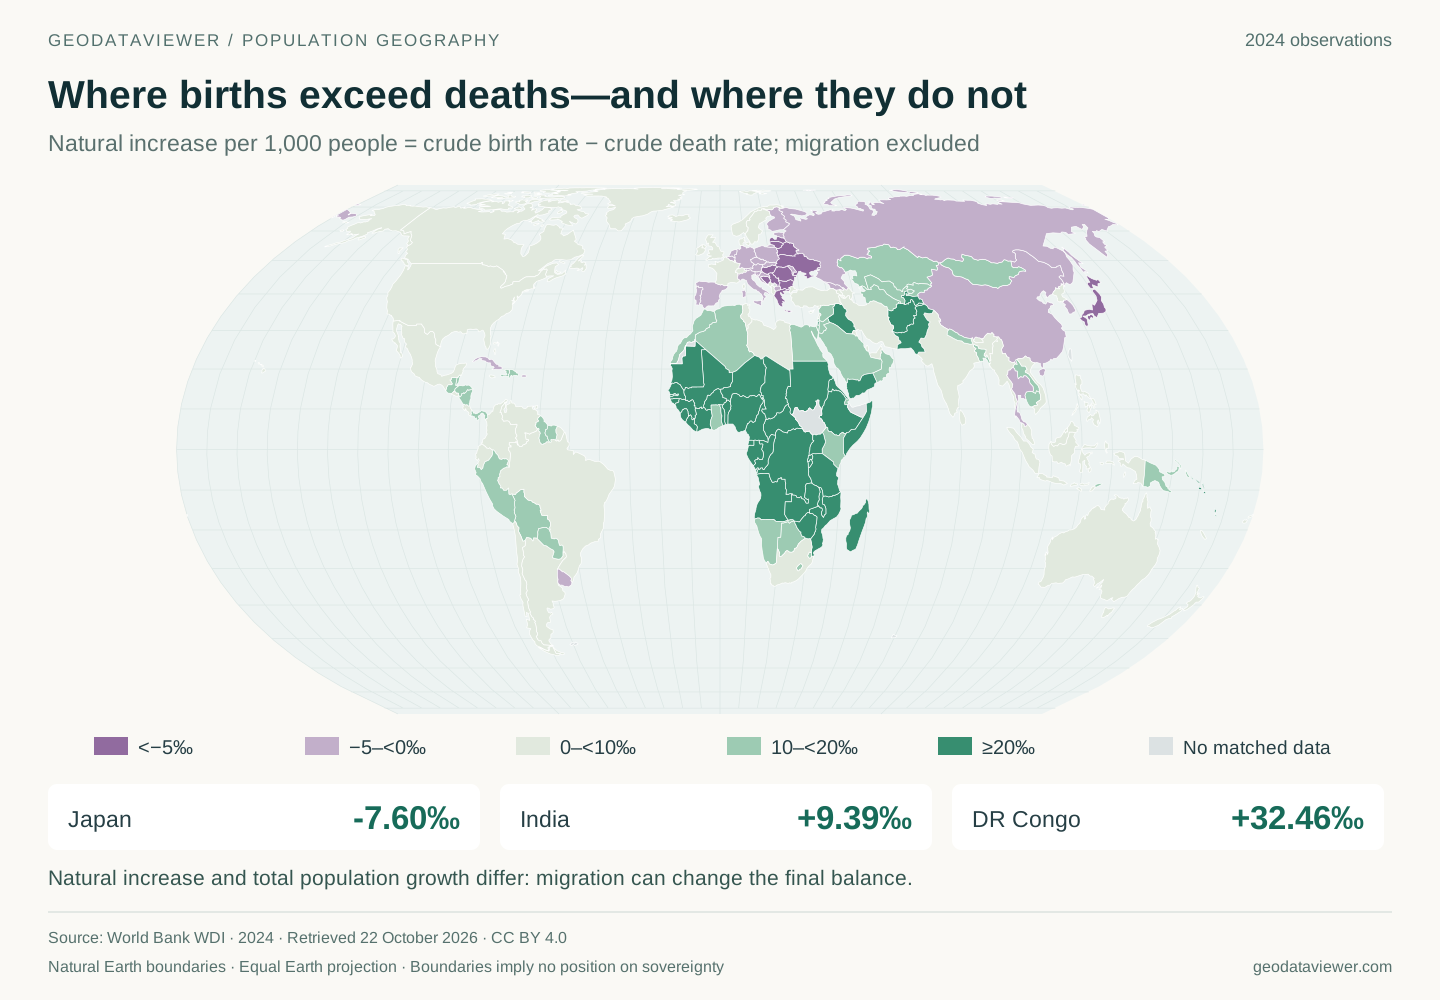
Subtracting the crude death rate from the crude birth rate gives natural increase. In this dataset it is approximately −7.60 per 1,000 in Japan, −0.99 in China, +9.39 in India and +32.46 in DR Congo. Remember the units: 10 per 1,000 is approximately 1%, not 10%. World Bank natural-increase definition
The full population balance also includes movement:
Population change = births − deaths + immigration − emigration.
Real statistical series may additionally contain registration corrections and census adjustments. Germany illustrates the underlying relationship: official statistics show approximately 330,600 more deaths than births in 2024, while total population increased by approximately 121,000. Net immigration offset the birth deficit. These German figures are cited together to explain the balance; they are not forced into a reconciliation with differently compiled World Bank growth observations. German birth and death statistics, 2024 population change
Scale changes the conclusion again. Migration can increase one country’s population without directly increasing the world’s population: an immigrant somewhere is an emigrant elsewhere. Migration can reshape labor supply and age composition, but adding together national immigration strategies does not create a global demographic solution. At the planetary level, births and deaths determine population change. UN analysis of population growth and migration
8. Population numbers describe pressures, not automatic outcomes
A large child population initially creates demand for nutrition, education, health care and care work. It becomes an economic opportunity only if those children later gain skills, health and productive employment. A demographic dividend is conditional, rather than a reward automatically paid to countries with more births. UNFPA on the demographic dividend
Older societies face a different timetable: labor participation, pensions, chronic disease management and long-term care require adjustment now. Even a fertility recovery would not immediately supply today’s workers or caregivers. Newborns take years to become adults, so supporting families and adapting to the existing age structure must proceed together.
Low fertility also records an outcome, not everyone’s preferences. In a 14-country survey published by UNFPA in 2025, 39% of relevant respondents reported that financial limitations had affected or would affect their ability to achieve their desired family size. This is not a precise estimate for every person worldwide, but it demonstrates why fewer births cannot simply be translated into less desire for children. UNFPA State of World Population 2025
Conversely, a high national fertility rate does not establish that every pregnancy is intended. National averages hide differences between places, income groups and households. They cannot tell us what an individual wants, or whether that person has the resources and freedom to realize it.
The maps point toward concrete questions: can children survive, learn and find opportunities; can longer lives also be healthier and supported; and can people make their own reproductive decisions? Answering those questions requires more than counting births or assigning countries a color.
Data, calculations and map design
The World Bank WDI observations were retrieved on 22 October 2026; the API reports an update date of 8 October 2026. All cross-sectional maps, the scatterplot and health comparison use 2024. Historical fertility endpoints explicitly use 2000. Missing observations are not replaced with other years. WDI combines UN and national statistical sources; these values are neither observed 2026 outcomes nor a direct copy of one UN projection vintage.
Estimated births equal population × crude birth rate ÷ 1,000; estimated deaths use the analogous death-rate calculation. Birth shares use the sum across 217 covered countries and economies, excluding regional and income aggregates, rather than the WDI WLD aggregate. Group comparisons use the common sample with all four required observations. Coverage, source differences and rounding mean the estimates should not be treated as exact registration counts. Small ranking differences—such as Indonesia versus DR Congo—should not be overinterpreted.
All six figures were independently rendered as SVG; the supplied image is not embedded. The four maps use the project’s existing Natural Earth boundaries and an Equal Earth projection. The simplified geography does not draw every economy separately. Gray means no matched observation, not zero; boundaries imply no position on sovereignty. Scatterplot dots have fixed size and a logarithmic vertical axis. The two-age mortality example is hypothetical.
Download the CSV · Inspect the source snapshot · Inspect the group calculations · Explore the interactive fertility map