A red boundary, a translucent green area, an airport icon: these are part of what a map communicates. Opening the file should preserve that information without making you rebuild its styling.
GeoDataViewer Studio now automatically recognizes supported styles in KML, KMZ and GeoJSON. Import a styled file and Studio uses its feature colors, line widths, transparency and icons. Points, lines and polygons can live in the same dataset, with point markers placed above lines and filled areas by default.
From a KMZ file to a styled map
The screenshot below shows a local Yemen War KMZ sample opened in Studio on a satellite basemap. The colored areas, boundaries and custom point symbols come from the file; they were not configured individually in Studio.
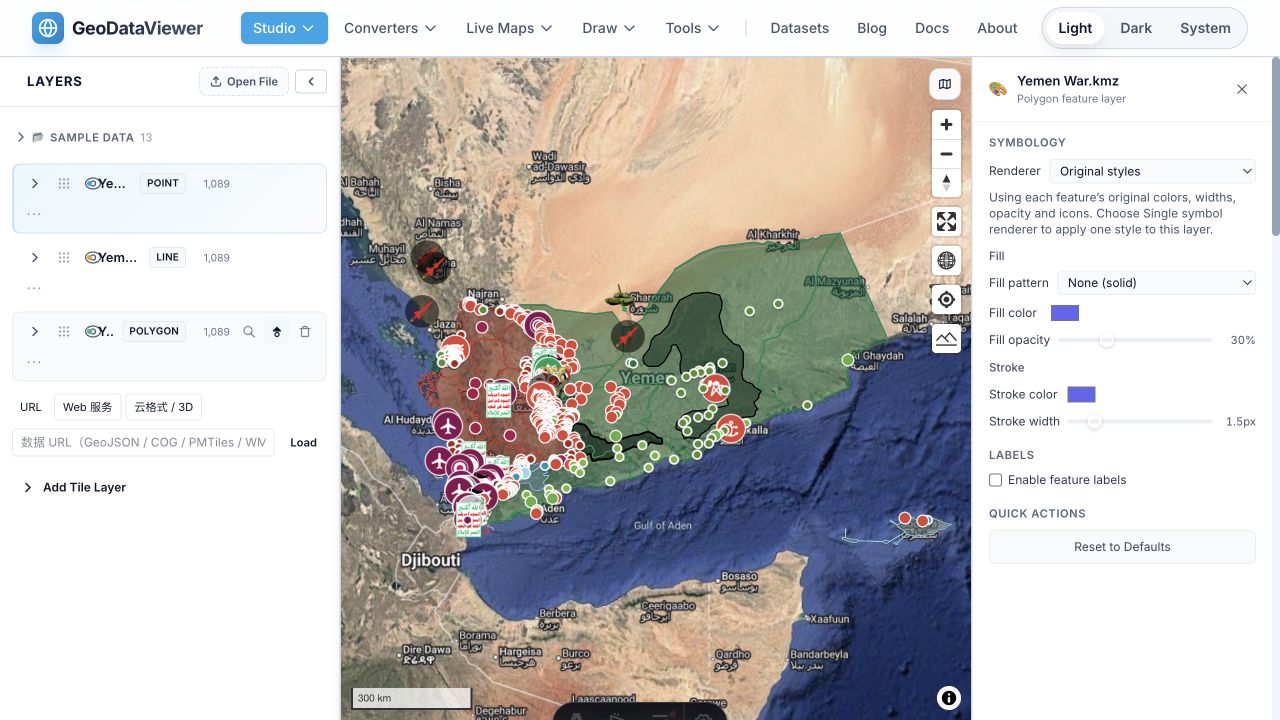
Real Studio capture using the supplied sample file. This illustrates file rendering, rather than a live update of the events depicted.
This sample contains 1,089 placemarks, 30 embedded PNG images and three additional external icon URLs. It is a useful example of a map that needs more than one color and one marker shape.
Studio reads supported Style and StyleMap definitions, including the normal style referenced by a StyleMap. It applies:
- IconStyle: icon references, color tint, opacity, scale and heading.
- LineStyle: line color, opacity and width.
- PolyStyle: fill color, opacity, and fill/outline visibility.
For KMZ files, supported embedded images are resolved from the archive, including paths relative to the KML document. You do not need to extract the image folder or host those images yourself. PNG, JPEG, GIF and WebP assets are supported.
Large source icons are fitted within 32 CSS pixels before the source scale is applied, preserving their aspect ratio. This keeps a large image asset from overwhelming the map while retaining the file’s relative icon scaling.
GeoJSON can carry its own styling, too
GeoJSON describes geometry and properties; it does not require one universal styling scheme. Many exports nevertheless include useful fields such as marker-color, stroke or fill. Other tools use names such as marker_color, line_color and fill_color.
Studio recognizes these conventions automatically. The converted Yemen GeoJSON sample has 1,084 features: 966 points, 14 lines and 104 polygon or multipolygon features. Its color and icon properties now drive the initial rendering.
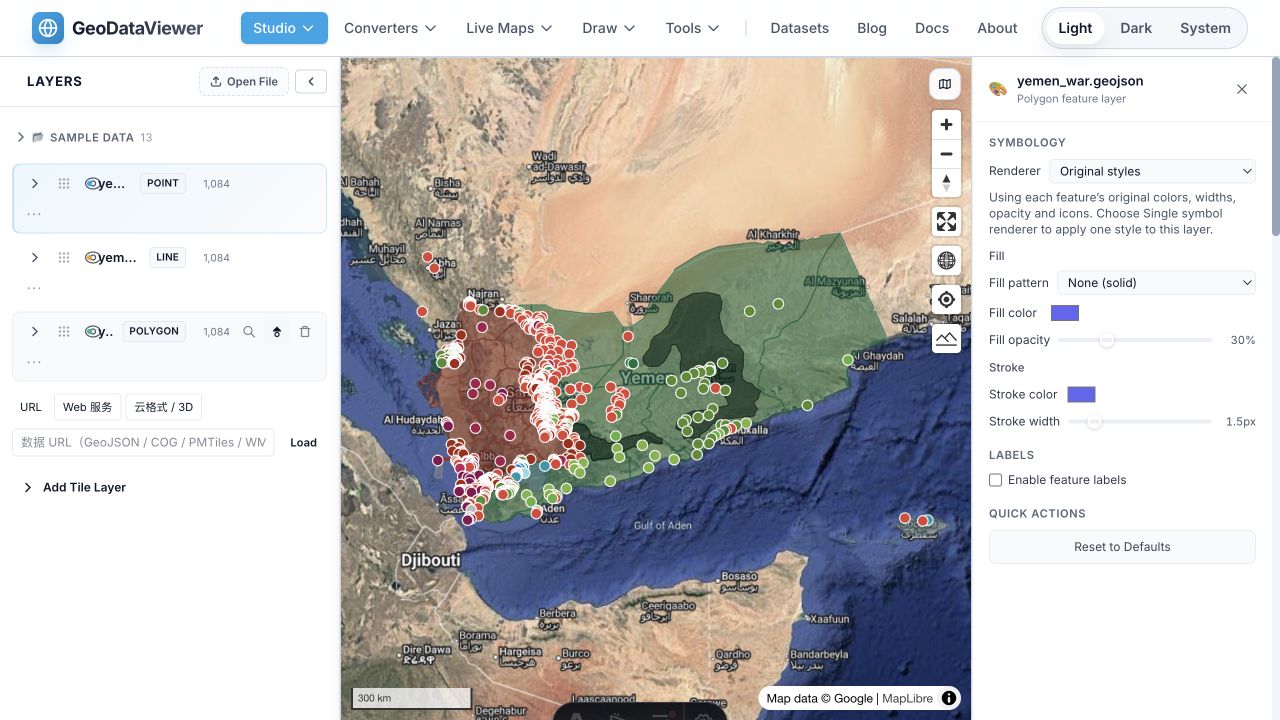
The GeoJSON retains colors and three stock icon URLs. It does not contain the KMZ’s complete set of custom images.
Supported GeoJSON style properties
Put these properties directly in each feature’s properties object. Aliases in each row are listed in lookup order: the first valid value wins.
| What it controls | Recognized properties | Accepted values |
|---|---|---|
| Point color / icon tint | marker_color, marker-color, icon-color, color | Hex color |
| Line or polygon border color | line_color, stroke, strokeColor, color | Hex color |
| Polygon fill color | fill_color, fill, fillColor, color | Hex color |
| Line or polygon border width | line_width, stroke-width, strokeWidth | 0–100 pixels |
| Polygon fill opacity | fill-opacity, fill_opacity, fillOpacity | 0–1 |
| Line or polygon border opacity | stroke-opacity, line_opacity, strokeOpacity | 0–1 |
| Point / icon opacity | icon-opacity, marker-opacity, marker_opacity | 0–1 |
| Point image | icon | HTTP(S) image URL or supported base64 image data URL |
| Image scale | icon-scale, icon_scale | 0–20 multiplier |
| Image rotation | icon-heading | 0–360 degrees |
Colors accept #RGB, #RGBA, #RRGGBB and #RRGGBBAA hex notation. For portable exports, six-digit hex colors plus separate opacity properties are a straightforward choice. Numeric values may also be supplied as numeric strings. Zero opacity stays fully transparent; missing or invalid styling values fall back to the layer defaults.
The image scale and heading fields apply to image markers. A color property tints an image when both are supplied, so omit the tint property if a multicolored image should retain its original colors.
A copyable example
Save this as styled-map.geojson and open it in Studio. It defines a colored point, a wider orange line and a translucent green polygon without requiring external images.
{
  "type": "FeatureCollection",
  "features": [
    {
      "type": "Feature",
      "properties": {
        "name": "Survey location",
        "marker-color": "#2563eb"
      },
      "geometry": { "type": "Point", "coordinates": [44.2, 15.4] }
    },
    {
      "type": "Feature",
      "properties": {
        "name": "Survey route",
        "stroke": "#ea580c",
        "stroke-width": 4,
        "stroke-opacity": 0.9
      },
      "geometry": {
        "type": "LineString",
        "coordinates": [[44.1, 15.3], [44.2, 15.4], [44.3, 15.5]]
      }
    },
    {
      "type": "Feature",
      "properties": {
        "name": "Study area",
        "fill": "#16a34a",
        "fill-opacity": 0.25,
        "stroke": "#166534",
        "stroke-width": 2
      },
      "geometry": {
        "type": "Polygon",
        "coordinates": [[[44.0, 15.2], [44.4, 15.2], [44.4, 15.6], [44.0, 15.6], [44.0, 15.2]]]
      }
    }
  ]
}
Your ordinary attributes remain available for inspection. Fields such as name, description, layer or your own project identifiers do not need to be removed to use source styling. Names and descriptions remain data attributes; this feature does not automatically turn every attribute into a label or interpret descriptions as styling instructions.
Keep the original look—or choose your own
To use the feature:
- Open Studio and drag in a
.kml,.kmzor.geojsonfile, or choose Open File. - When supported styling properties are present, Studio selects Original styles automatically.
- Open a layer’s Style controls to see its renderer.
- Choose Single symbol renderer to apply one style to that layer, or use the existing graduated and categorized renderers for your own analysis.
- Switch back to Original styles to restore the source-driven appearance.
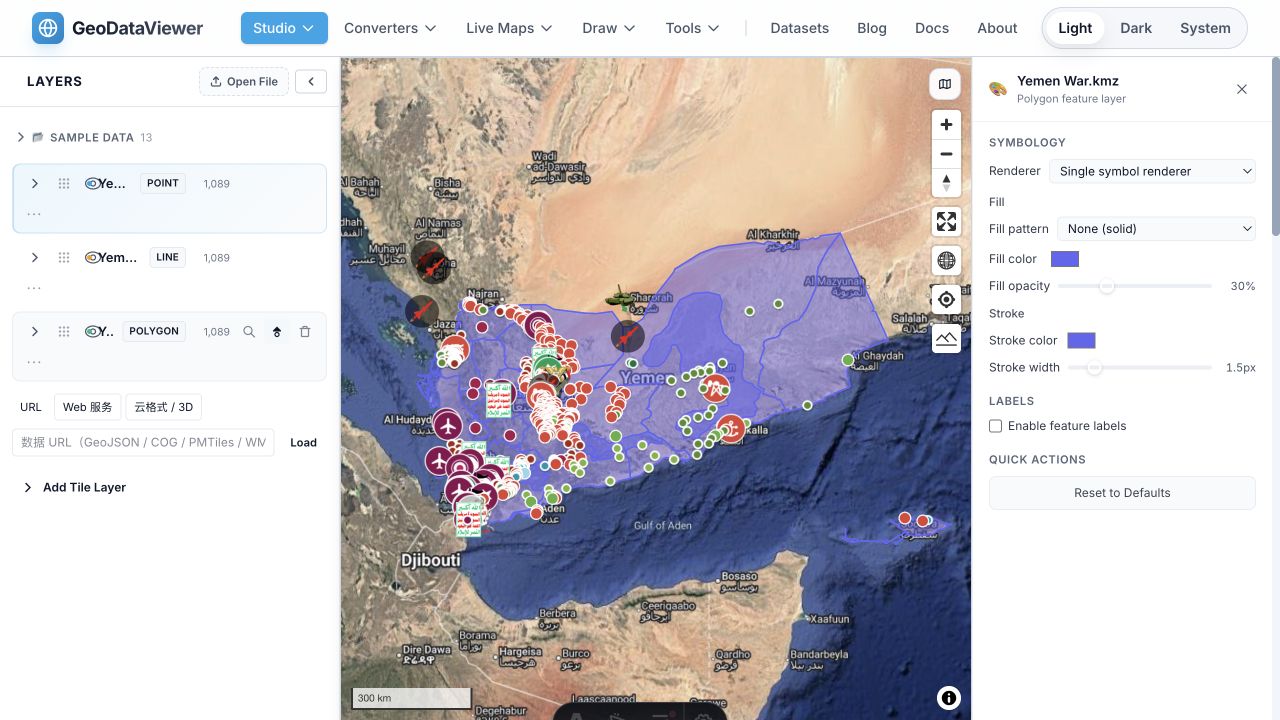
Only the polygon layer was changed here. The point icons retain their original appearance.
The source styling also survives basemap changes. You can compare the same data against a street map or satellite imagery without setting its colors and icons again.
What to know about icons and conversion
A KMZ is often the most complete version of a styled map. It can include both the KML styling and the actual image files. A converted GeoJSON can retain feature colors while losing icon assets, image references or other source information. Studio can render the properties and images that are present; it cannot reconstruct assets omitted by a conversion.
In this example, the KMZ and GeoJSON also have different feature counts. They should not be treated as identical copies simply because one was converted from the other.
Embedded images stay local. File parsing and KMZ image extraction happen in the browser, with no upload of your dataset. Basemaps and external icon URLs still make network requests. External images need to be accessible to the browser and allow cross-origin loading; failed image loads retain a fallback marker so a point does not disappear. Embedded base64 images support PNG, JPEG, GIF and WebP.
This is support for common source symbology, not every KML presentation feature. Automatic LabelStyle reproduction, BalloonStyle layouts, ground overlays and complete Google Earth/My Maps visual parity are outside this feature’s scope. You can still enable and configure feature labels through Studio’s label controls.
Open the file and see what its styles tell you
Source styling is useful for shared project maps, field surveys, routes and thematic areas—anywhere colors and symbols help explain the geometry. Studio lets you inspect that map first, then restyle it when you need a different view.
Try original map styles in Studio →
Related guides: Open KML and KMZ online · Open GeoJSON online · What is GeoJSON?