ECMWF AIFS Global AI Weather Forecast Map
Quick answer: ECMWF AIFS Global AI Weather Forecast Map shows continuous temperature, rain and wind-component grids at 0.25° resolution. Rotate the globe and change the raster time, or click a location for a separate point query. Source: dynamical.org, CC BY 4.0.
About this dataset
Explore continuous ECMWF AIFS Single temperature, precipitation and wind-component grids on a globe. Switch model runs and forecast lead times, then query a location.
This model provides forecasts out to 15 days. The continuous global raster reads a selected variable directly from the current STAC-resolved Icechunk/Zarr archive at 0.25° resolution. Select a model run and forecast lead time; UTC valid time is their sum. Initial loading can take several seconds because complete compressed chunks must be decoded. Run availability may change while data arrives; missing cells remain transparent. The color field comes from the source grid, not an interpolation of the eight sample points. The point-query API is separate: it exports the first 72 forecast hours as GeoJSON. Point and raster time controls are independent. Wind layers show signed eastward and northward components in m/s, not total wind speed. ECMWF AIFS Single forecast data processed by dynamical.org from ECMWF Open Data. Raster displays and point-series exports are adaptations by GeoDataViewer.
Data source: ECMWF AIFS Single forecast data processed by dynamical.org from ECMWF Open Data.
Attribution: ECMWF AIFS Single forecast data processed by dynamical.org from ECMWF Open Data. CC BY 4.0. Map previews and point-series exports are adaptations by GeoDataViewer.
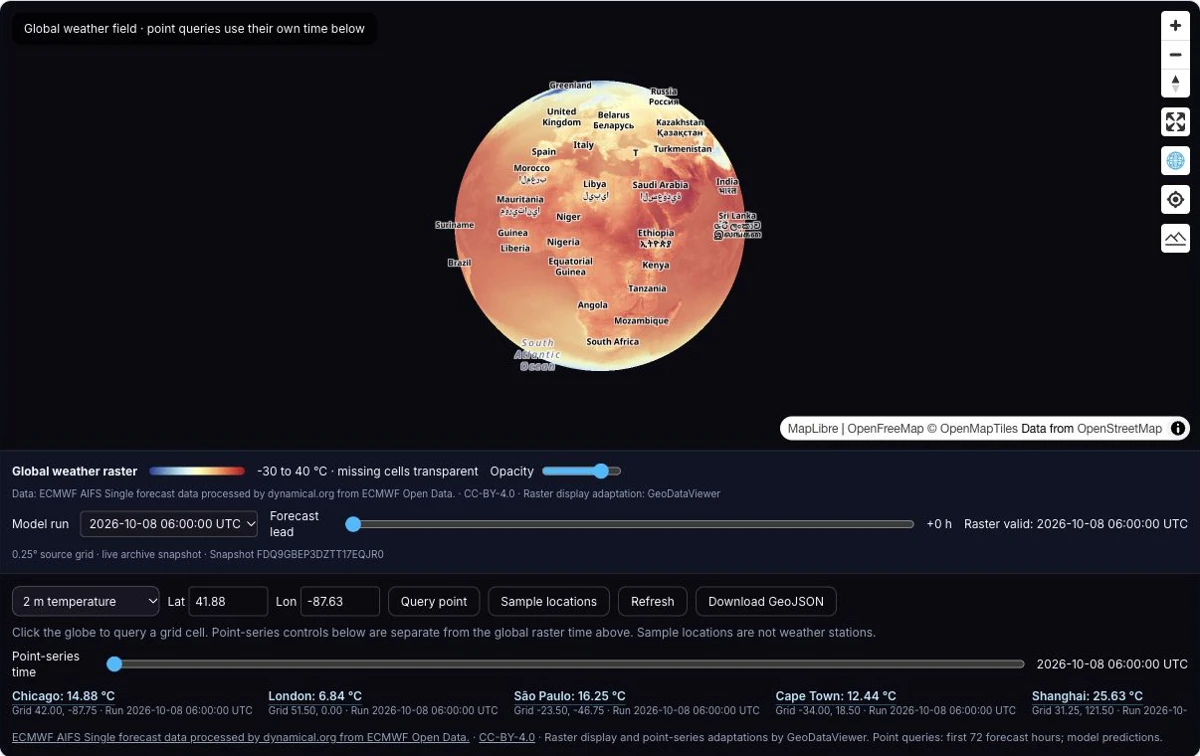
Actual continuous global temperature raster captured 8 October 2026; model run and valid time 8 October 2026 at 06:00 UTC. The globe renders the original 0.25° forecast grid. Source, license and basemap credits are visible.
How to download
- 1 Select a variable and use the global raster time control to explore its spatial pattern.
- 2 Click the globe or enter coordinates for a separate point query; inspect its UTC time and selected grid cell.
- 3 Use Download GeoJSON to save the queried series with its attribution, license and snapshot identifier.
- 4 For original gridded data, open the official catalog examples and resolve the Icechunk asset from current STAC metadata. Limit variables, area and time before loading.
FAQ
How is the global weather raster loaded?
The browser reads the selected variable from the STAC-resolved Icechunk/Zarr archive using icechunk-js and renders it with a globe-capable Zarr layer. The continuous field uses the original 0.25° grid; it is not interpolated from sample cities. No account or API key is required.
What attribution is required?
ECMWF AIFS Single forecast data processed by dynamical.org from ECMWF Open Data. Data is licensed CC BY 4.0. Preserve this credit, link to the original source and license, and indicate any changes. GDV's point-series export records this provenance.
What do the times mean?
Initialization time is the model run in UTC. Valid time is initialization plus forecast lead time. Missing steps remain missing; a model forecast is not a measured observation.
Are uploaded files sent to dynamical.org?
No files are uploaded. Global forecasts are read from public cloud archives; the satellite display uses cached grid files. Point queries send the selected coordinates, product, variable and time window to the public dynamical.org API.